Tutorial : Geometric Patterns(1)
To create simple geometric shapes we need to change the shader properties based on whether that particular point in space represents a point 'inside' or 'outside' a particular region. For example, to create a solid circle we can simply determine the distance to the centre of the circle; if this distance is less than the radius of the circle then that point is 'inside' the circle, otherwise it is 'outside'. In essence, we need to take the Input Coordinates and perform some operations on those coordinates to produce an Output that can be used to control a shader.
Input Coordinates
The choice of input coordinates is important since this affects the position and range of the points within space. For now, we'll stick with Object coordinates since it is the most consistent and is centred around the origin of the mesh and measures the distance from that origin in each direction as X,Y,Z - where (0,0,0) is the origin and each of the X,Y,Z coordinates can be positive or negative, depending on the direction.
Scene Setup
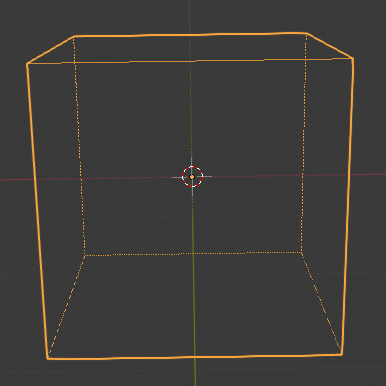
For simplicity, we'll start with the Default Cube as in the default scene when you first start Blender (assuming you haven't overridden the default scene). This is a Cube of 2 units per side, with the origin in the centre. This means that when using Object coordinates, (0,0,0) - the origin - will be in the centre of the cube and each of the X,Y,Z coordinates will run from -1.0 at one 'edge' to +1.0 at the opposite edge.
First example : Banding
For a simple first example we can concentrate on a single axis - in this case the 'Z' axis. We can create horizontal bands on our mesh by varying the color based on the Z coordinate. Using nodes we can do the following :
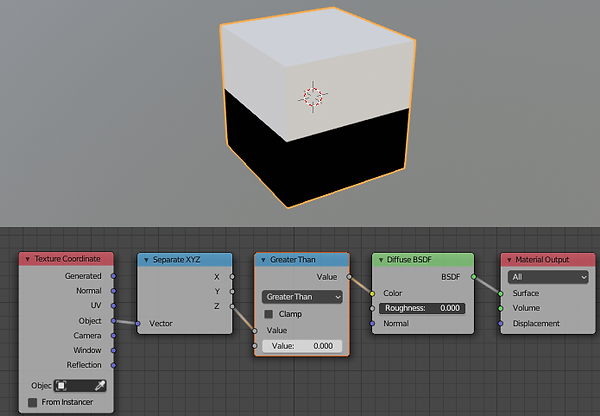
In the above example we're taking the Object coordinates, splitting them into individual X,Y,Z coordinates and using the Z coordinate to determine the color of that point in the shader - in this case, we'll output 1 (white) if Z is greater than 0.0, otherwise 0 (black).
Taking this a step further, we could create a 'band' by including an addition test to compare with another value, above which we'll switch batch to black. ie, output 1 (white) if Z is greater than 0.0 and Z is less than 0.5.

We can continue this process to create ever more complicated configurations to produce virtually any output we desire. This is known as a Procedural Texture, since the output is produced using a procedure (calculations) rather than from values stored in an image. One of the real powers of procedural textures is that they are not limited to the properties or resolution of any image; for example, a well produced procedural texture can be used at virtually any scale without becoming 'pixelated', as well as being versatile so that many variations be produced by adjusting input variables (for example, for patterns of the grain on the surface of sawn planks - with an image you are limited to those pattern you have 'baked' into your original texture image but by using a procedural texture to generate the 'grain' you can create many variations of the same texture for each plank, making each unique.
While this is possible with nodes, it can quickly become very cumbersome as the number of nodes increases - and spotting errors becomes increasingly more difficult and time consuming. This is where the Node Expressions add-on comes in handy since it takes a written expression and automatically generates the nodes. Amending the expression re-builds the nodes so different configurations can be very easily tested. For further examples I'll use Node Expressions to generate the nodes - the 'Lite' (free) version will be sufficient to get started - so we can concentrate on the expression rather than the nodes.
To create our 'band' in the above example we need to be able to state :
Z is greater than 0 and z is less than 0.5
This can be simply written as :
(z>0) * (z<0.5)
Note that the '*' is a Multiply operation; in this case the Multiply takes the place of the 'and', to combine each test to produce the final result. Using Node Expressions, simply select Add, Maths Expression and enter the expression as shown.
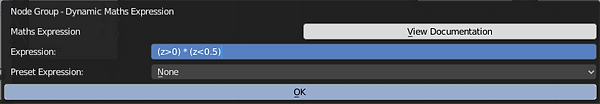
This will produce a group node and should produce the result as shown :


Variable Inputs
In order to produce something more practical, we can use Variables for the input values - rather than the fixed values of '0' and '0.5' - by simply including them in the expression. So, for example :
(z>LowerZ) * (z<UpperZ)
This produces a group node that can be adjusted by varying the value of the input nodes :
Added Dimension
By including an additional axis (eg, X) the "band" can be limited to a specific range in a similar way to that described above :
(z>LowerZ) * (z<UpperZ) * (x>LowerX) * (x<UpperX)
This produces a group node to produce any size/position/dimension rectangle that can be adjusted by varying the value of the inputs :